

In this post, I summarise my custom settings for my IPython, Matplotlib and IPython Notebook for my Windows machine at work.
IPython
First some aesthetic preferences:
[code lang=”python” title=”.ipython/profile_default/ipython_config.py”]
# select qt backend for plotting from terminal
from IPython.terminal.ipapp import TerminalIPythonApp
TerminalIPythonApp.matplotlib=’qt’
c = get_config()
# bigger plots in IPython notebooks
c.InlineBackend.rc = {‘figure.figsize’: (16.0, 8.0), ‘savefig.dpi’: 72}
[/code]
These are for productivity, mainly:
[code lang=”python” title=”.ipython/profile_default/startup/setup.ipy”]
# always reload packages interactively
%load_ext autoreload
%autoreload 2
# import mainly used packages
import numpy as np
import pandas as pd
import matplotlib.pyplot as plt
# change to pandas default "beautiful" style
pd.options.display.mpl_style = ‘default’
# but keep sans-serif fonts (instead of monospace)
plt.rcParams[‘font.family’] = ‘sans-serif’
[/code]
Matplotlib
For coherence with my employer’s style guide, I set my plot font to Arial with the following two lines:
[code title=”.matplotlib/matplotlibrc”]
font.family : sans-serif
font.sans-serif : Arial
[/code]
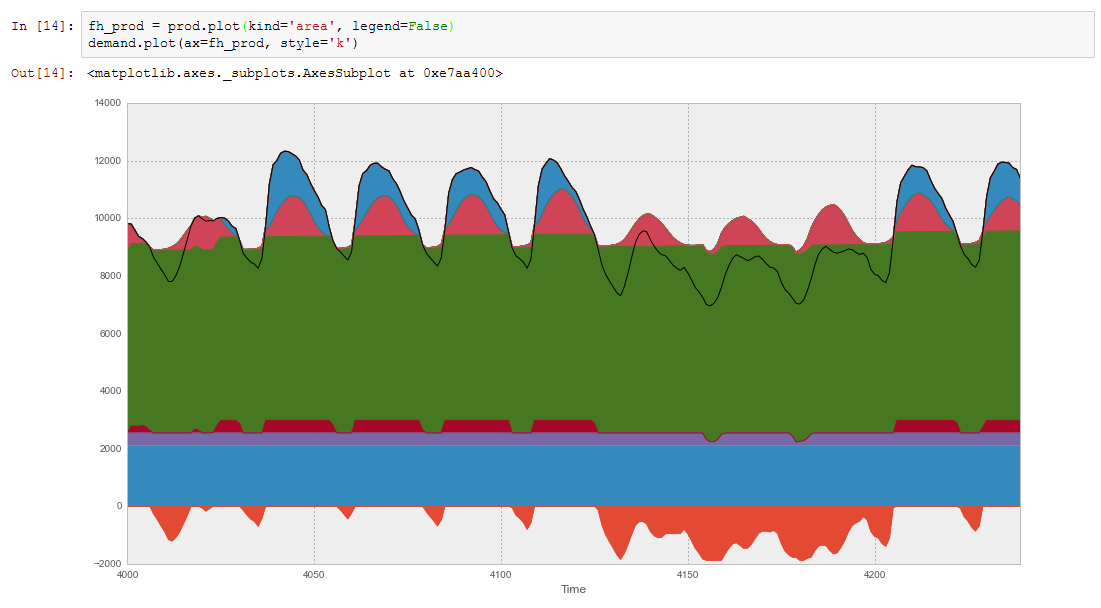
All this results in the following default plot appearance (here for a Pandas area plot of multiple timeseries):
Share as Gist toolbar button
Pre-requisite: you must have a GitHub account and create a Personal access token for your share button, so that it may upload code in your name.
Once that is prepared, get the file gist.js from minrk’s ipython extensions GitHub repository and place it in in the folder .ipython/nbextensions.
Then add the following lines to file custom.js, located in your profile:
[code lang=”js” title=”.ipython/profile_default/static/custom/custom.js”]
require(["nbextensions/gist"], function (gist_extension) {
console.log(‘gist extension loaded’);
gist_extension.load_ipython_extension();
});
[/code]
The next time you launch ipython notebook, a share button should appear in every notebook’s toolbar. The first time you click it, you must paste your GitHub access token. From there on, it will work automatically. Here is how it looks in action:
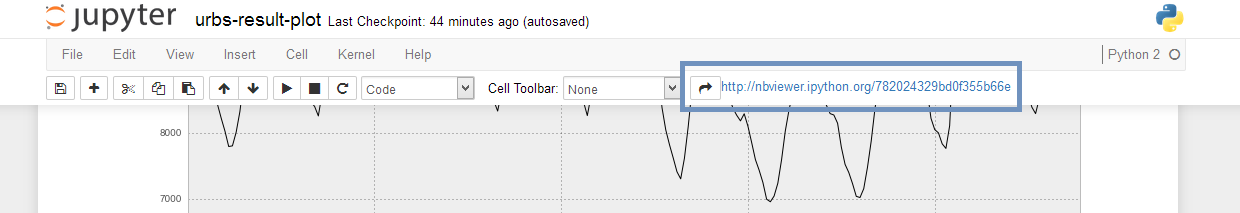
(And here is the link to the corresponding Notebook: urbs-result-plot.ipynb.)